> ## Documentation Index
> Fetch the complete documentation index at: https://docs.overlap.ai/llms.txt
> Use this file to discover all available pages before exploring further.
# Performance
> See how a campaign is tracking against its monthly target.
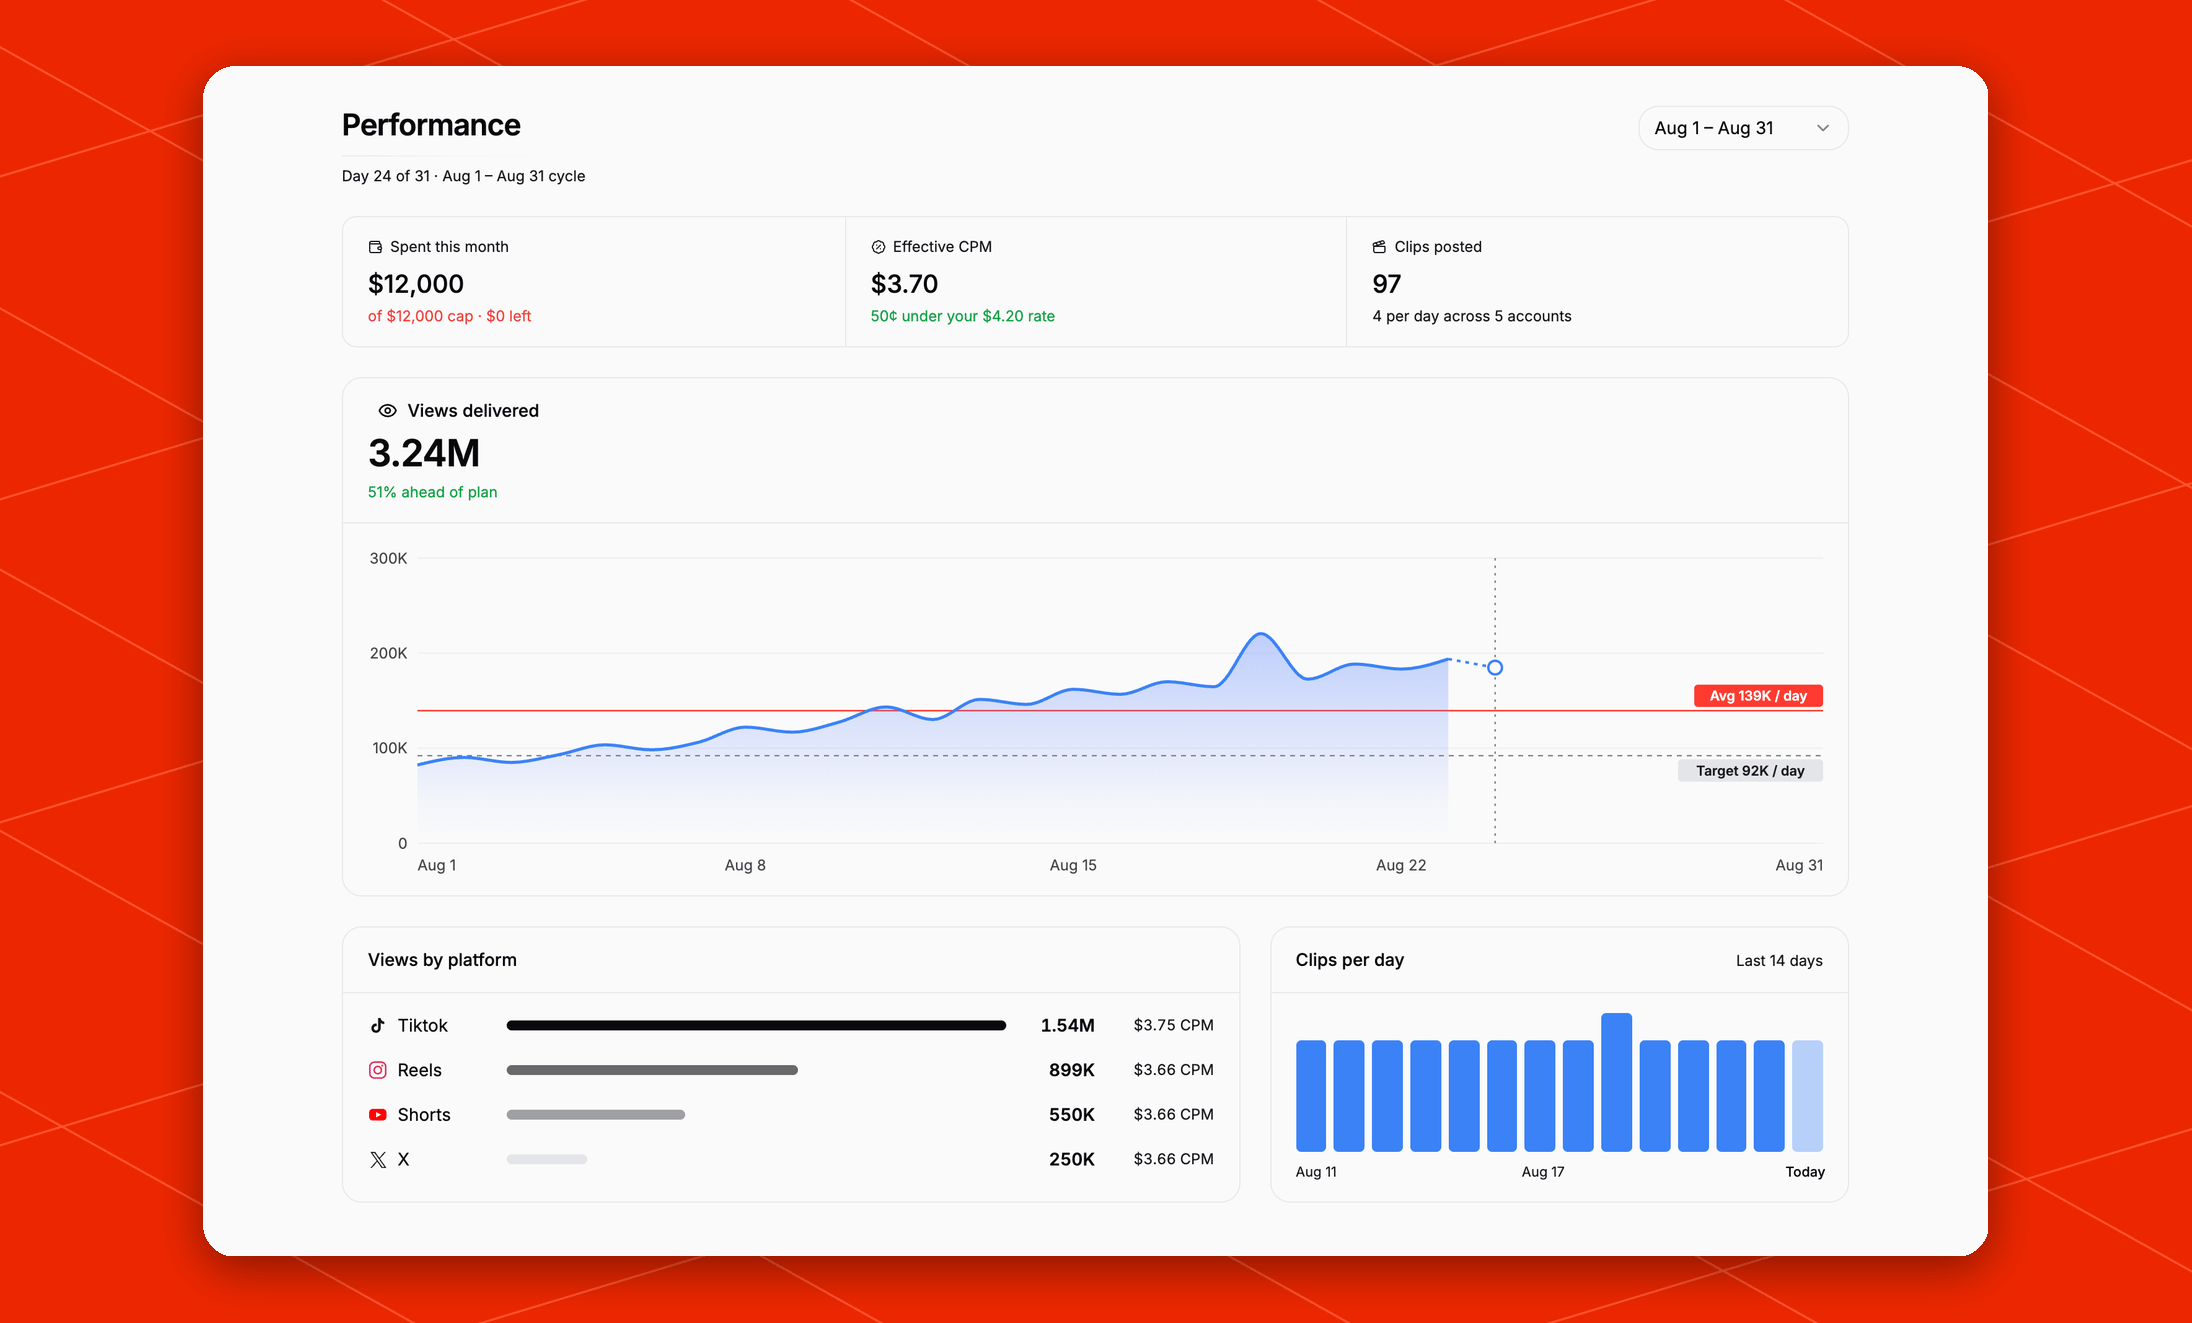
> **Performance** answers two questions: is this campaign on track, and does anything need your attention?
 ## Choose what you're looking at
The page shows one campaign and one billing cycle at a time. A billing cycle is a calendar month.
* **Campaign picker**: appears when you have more than one campaign. It starts on the campaign with the most views. Paused or ended campaigns are labeled with their status.
* **Cycle picker**: choose an earlier month. Months when the campaign didn't post are grayed out.
The header also shows how far through the cycle you are, for example *Day 12 of 30*.
To open this page for a specific campaign, click **View full performance** in that campaign's [updates](/managed/campaigns#campaign-updates).
## Summary tiles
| Tile | What it shows |
| -------------------- | ------------------------------------------------------------------------------------------------------------------------------------ |
| **Spent this month** | Spend so far this cycle compared with your monthly cap, and how much is left. It turns red when the cap is reached. |
| **Effective CPM** | What you're effectively paying per 1,000 views. It matches your agreed rate until the campaign reaches its cap, then drops below it. |
| **Clips posted** | Clips posted this cycle and the average per day across your accounts. |
| **Trending posts** | Appears only when one of your posts is trending. Click it to see which posts. |
## Views delivered
The main chart shows daily views for the cycle.
* The heading shows the total views delivered and whether you're ahead of or behind plan. During the first two weeks, a **Warming up** label reminds you that volume is intentionally low. See [Campaign status](/managed/campaigns#campaign-status).
* **Target / day** is the daily pace that would use your full monthly cap by the end of the month.
* **Avg / day** is your actual daily average so far.
* Today's point is a dotted projection because today's posts are still collecting views.
Each day's views are the views earned so far by posts *published* that day. Posts keep earning views for days after they go out, so recent days keep growing.
## Views by platform
This panel shows how the cycle's views break down across Reels, Shorts, TikTok, X, and other platforms, with the effective CPM for each.
## Clips per day
A bar for each recent day shows how many clips were posted. Today's bar is faded because the day isn't over. Hover over a bar to see the exact count.
## Choose what you're looking at
The page shows one campaign and one billing cycle at a time. A billing cycle is a calendar month.
* **Campaign picker**: appears when you have more than one campaign. It starts on the campaign with the most views. Paused or ended campaigns are labeled with their status.
* **Cycle picker**: choose an earlier month. Months when the campaign didn't post are grayed out.
The header also shows how far through the cycle you are, for example *Day 12 of 30*.
To open this page for a specific campaign, click **View full performance** in that campaign's [updates](/managed/campaigns#campaign-updates).
## Summary tiles
| Tile | What it shows |
| -------------------- | ------------------------------------------------------------------------------------------------------------------------------------ |
| **Spent this month** | Spend so far this cycle compared with your monthly cap, and how much is left. It turns red when the cap is reached. |
| **Effective CPM** | What you're effectively paying per 1,000 views. It matches your agreed rate until the campaign reaches its cap, then drops below it. |
| **Clips posted** | Clips posted this cycle and the average per day across your accounts. |
| **Trending posts** | Appears only when one of your posts is trending. Click it to see which posts. |
## Views delivered
The main chart shows daily views for the cycle.
* The heading shows the total views delivered and whether you're ahead of or behind plan. During the first two weeks, a **Warming up** label reminds you that volume is intentionally low. See [Campaign status](/managed/campaigns#campaign-status).
* **Target / day** is the daily pace that would use your full monthly cap by the end of the month.
* **Avg / day** is your actual daily average so far.
* Today's point is a dotted projection because today's posts are still collecting views.
Each day's views are the views earned so far by posts *published* that day. Posts keep earning views for days after they go out, so recent days keep growing.
## Views by platform
This panel shows how the cycle's views break down across Reels, Shorts, TikTok, X, and other platforms, with the effective CPM for each.
## Clips per day
A bar for each recent day shows how many clips were posted. Today's bar is faded because the day isn't over. Hover over a bar to see the exact count.