
Performance answers two questions: is this campaign on track, and does anything need your attention?
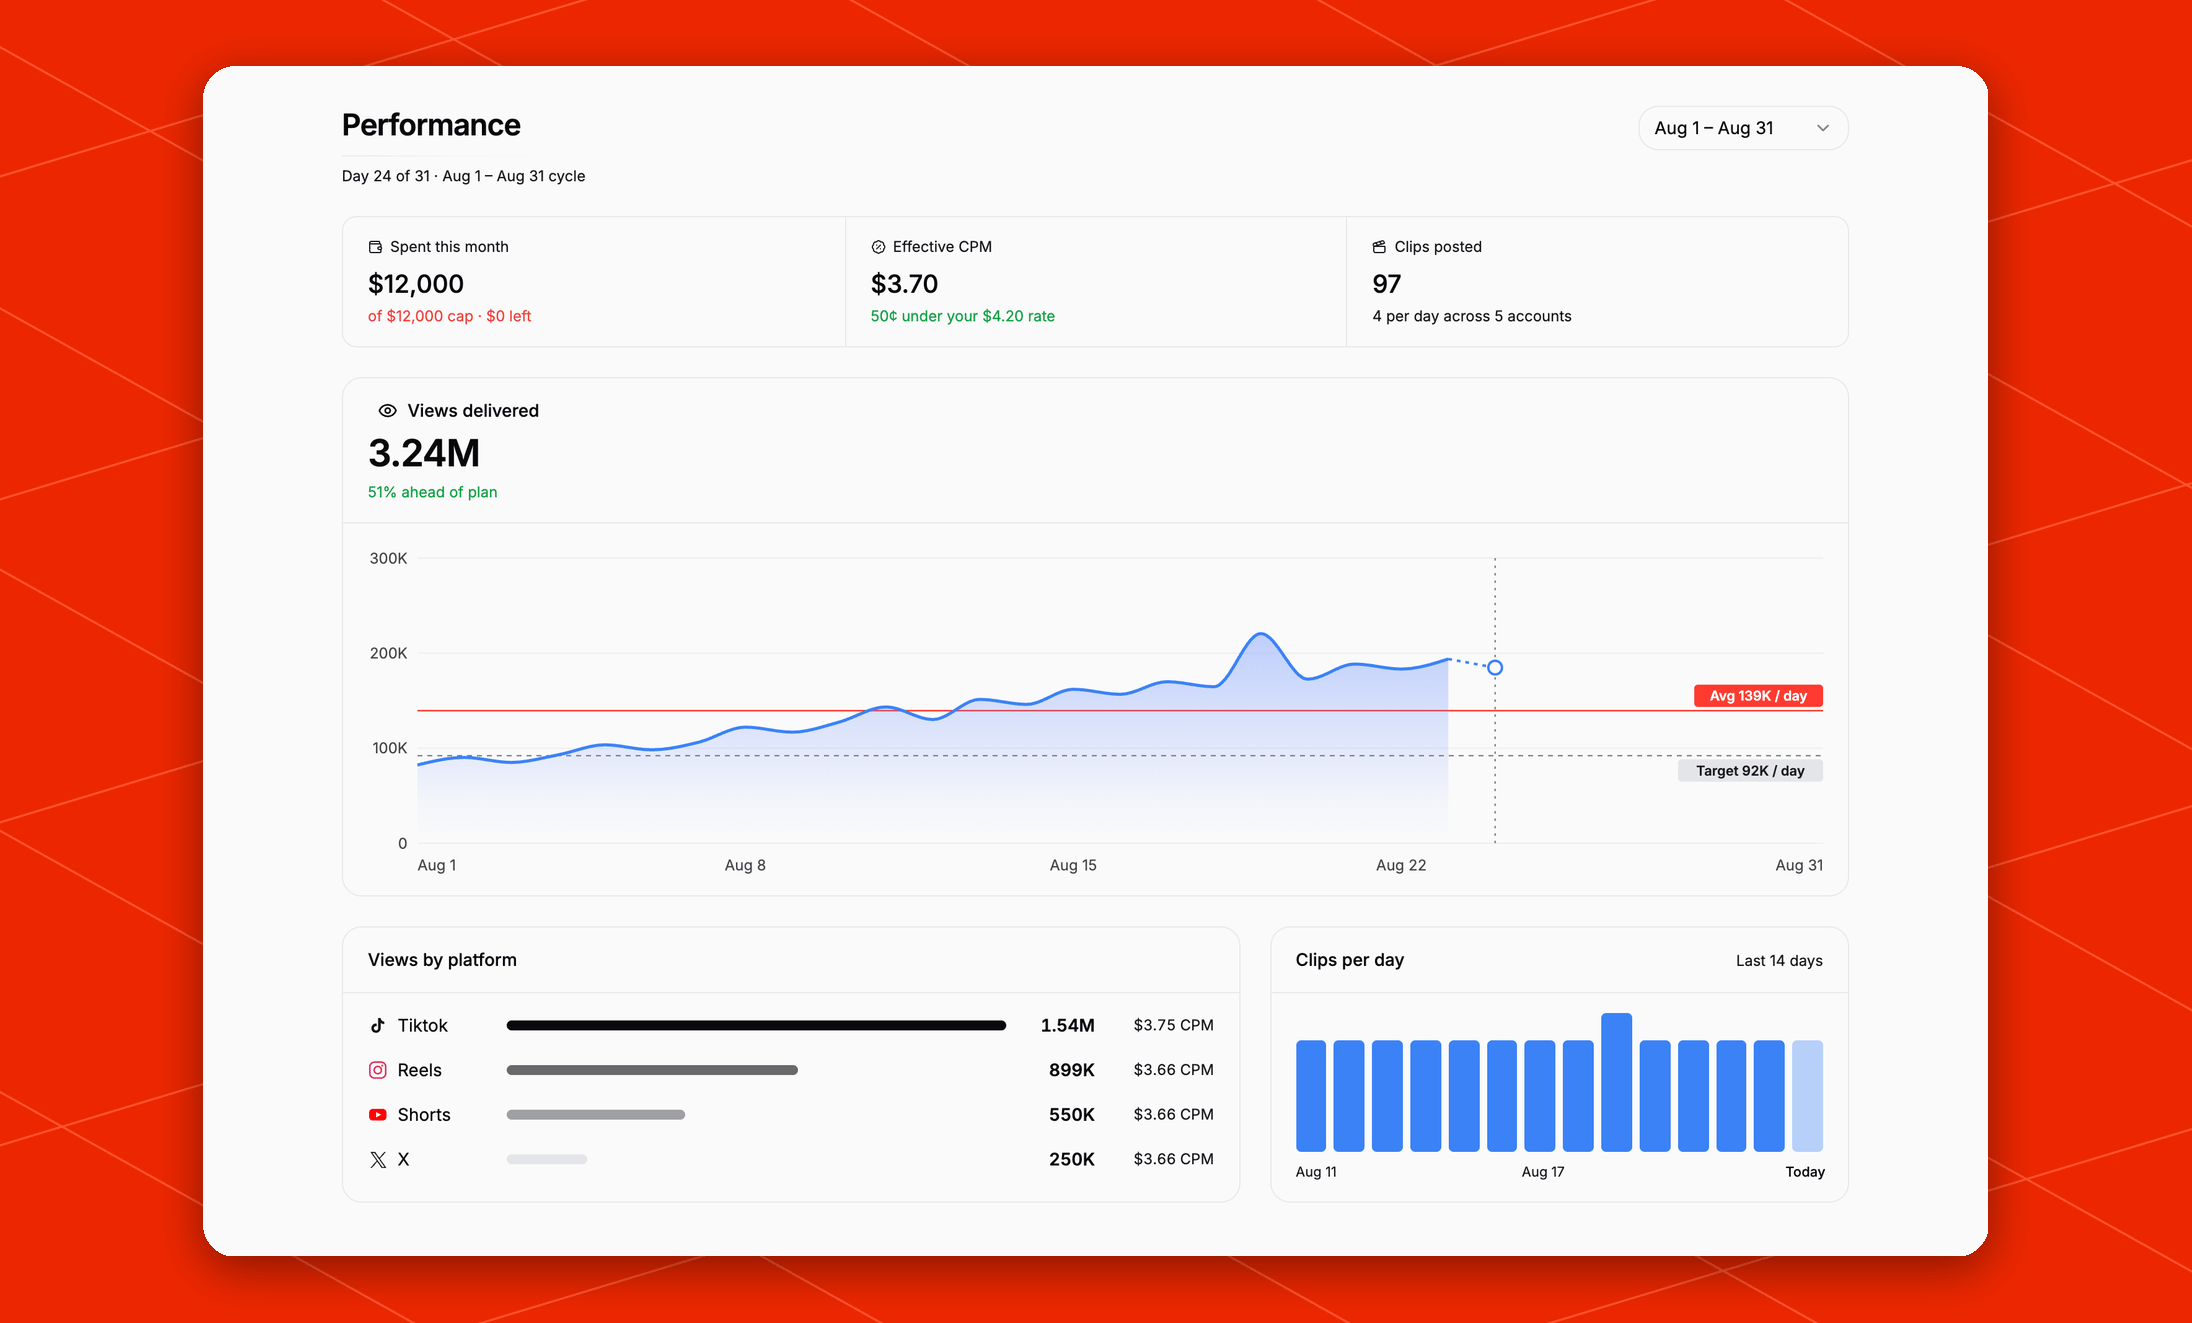
Choose what you’re looking at
The page shows one campaign and one billing cycle at a time. A billing cycle is a calendar month.- Campaign picker: appears when you have more than one campaign. It starts on the campaign with the most views. Paused or ended campaigns are labeled with their status.
- Cycle picker: choose an earlier month. Months when the campaign didn’t post are grayed out.
Summary tiles
Views delivered
The main chart shows daily views for the cycle.- The heading shows the total views delivered and whether you’re ahead of or behind plan. During the first two weeks, a Warming up label reminds you that volume is intentionally low. See Campaign status.
- Target / day is the daily pace that would use your full monthly cap by the end of the month.
- Avg / day is your actual daily average so far.
- Today’s point is a dotted projection because today’s posts are still collecting views.